ISHRS Practice Census: 2015
- Hair Transplantation
- Before & After Hair Transplant Photos
- Hair Transplant FAQ
- Answers
- Physician Consult
The 2015 hair restoration practice census, published by the International Society of Hair Restoration Surgery (ISHRS), showed that hair transplantation is an increasingly popular treatment for hair loss. The biennial survey found that 397,048 procedures were performed in 2014, an estimated increase of 28% over the previous survey, published in 2012. Three prior surveys found increases of up to 12%, so the rate of surgical hair restoration seems to be accelerating.
Since 2006, the number of procedures worldwide has increased 76%, with the estimated global hair restoration market now valued at approximately $2.5 billion annually.
Age
Over half of all men and women treated were younger than 50. Men aged 30-39 made up the biggest percentile at 31.7%, followed by those aged 40-49 (26.9%). It was the inverse for women, however, with those aged 40-49 making up the biggest percentile at 27.7%, followed by women in the 30-39 year old bracket (27.0%).
Procedure
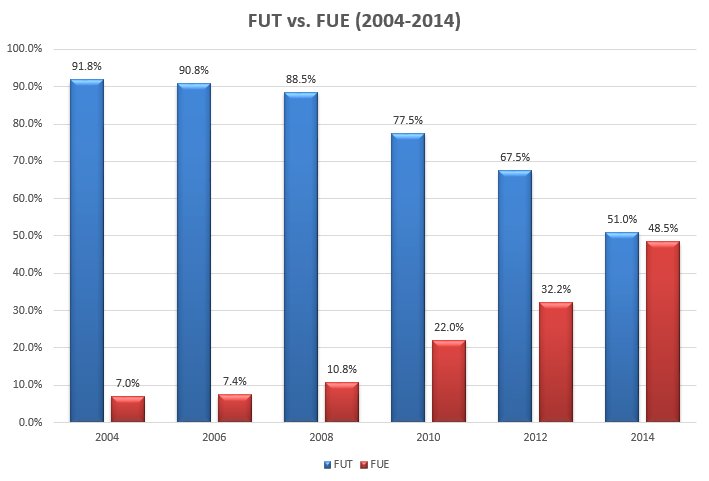
While Follicular Unit Transplant (FUT) procedures accounted for over half of all hair transplants, Follicular Unit Extraction (FUE) is gaining rapidly, with a 51% increase over the 2012 results (from 32.2% in 2012 to 48.5% in 2014). See chart below.
Gender
In 2014, 84.7% of surgical patients were men and the rest (15.3%) were women. The number of women receiving a hair transplant increased by 12% since 2012. There was also a 21% increase in non-surgical female patients.
ISHRS Practice Census: 2011
The International Society of Hair Restoration Surgery (ISHRS) has published the results of their biennial survey of hair restoration physicians from around the world. The survey — published in the November/December 2011 issue of Hair Transplant Forum International — asked members of the ISHRS to answer questions on patient demographics, surgical techniques, number of procedures, and more in order to gauge the state of the industry.
Here are some of key findings:
Procedures:
- The economy is still sluggish, but demand for hair restoration is stronger than ever.
- Extrapolated worldwide, the number of hair restoration procedures in 2010 was approximately 279,381; up 11% from 2008; and up 66% compared to 2004.
- There were 923,599 total hair restoration patients worldwide in 2010 (a 14% increase from 2008).
- 251,208 were surgical patients and 672,391 non-surgical.
- Compared to 2004, the combined total of surgical and non-surgical patients has increased 156%.
- Since 2004, the number of hair restoration patients in the Middle East grew 454%, in Asia the number of patients grew 345%.
Hair Restoration Industry:
- Total market size increased 47.9% from 2008 to 2010.
- Estimated market size in dollars: $1,875,878,580 ($1.88 Billion).
Gender:
- Proportion of male surgical patients to female patients was nearly unchanged from 2008 (males were 85.9% of patients while female patients made up 14.1% of the total).
- Proportion of male non-surgical patients to female non-surgical patients was also nearly unchanged from 2008 (male patients made up 65.2% of the total, while females were 34.8%).
Age:
- On average, male patients tended to be slightly younger than female patients.
- More than half of both male and female patients fell between the ages of 30 to 49 years old.
- The average age of a physician’s youngest patient in 2010 was 22 years old.
- The average age of a physician’s oldest patient in 2010 was 65 years old.
Worldwide:
- Every country or region, except Australia, grew in volume of surgeries.
- The country or region with the most procedures was the U.S.A. (with 101,252 surgeries, an increase of 3% from 2008).
- Asia was second with 92,075 procedures (an increase of 17% from 2008).
- Canada had 8,598 procedures, up 63% from 2008.
- Middle East had 23,136 procedures, up 12%.
- Europe had 33,194 procedures, up 3%.
- Mexico/Central America/South America had 18,072, up 38%.
- Australia had 3,055 procedures, down 2%
Non-scalp Procedures:
- Non-scalp procedures were relatively constant in 2010 compared to 2008.
- 92.8% of procedures were scalp procedures.
- 4.4% were eyebrow procedures.
- 1.5% were facial, mustache, or beard surgeries.
- 0.6% were eyelash procedures.
- Eyelash, eyebrow, and facial procedures were up 14.2% in 2010 from 2008.
- In the U.S.A. facial hair restoration procedures nearly doubled in 2010 from 2008.
ISHRS Practice Census: 2009
In the summer of 2009 the International Society of Hair Restoration Surgery (ISHRS) published the results of a survey of hair restoration practices around the world. The survey; published in the journal Hair Transplant Forum International (July/August 2009, Volume 19, No. 4); looked at, “the volume of hair restoration procedures performed, patient demographics, surgical techniques, treatments used, and other practice dynamics,” to gauge the health of the industry.
Results of the survey showed that hair restoration procedures are increasing in popularity worldwide.
Here are some of the key findings broken into categories:
Around the World
- Total worldwide hair restoration patients: up 26% from 2006 to 2008
- Worldwide hair restoration surgical procedures: up 9% from 2006 to 2008
- Worldwide hair restoration non-surgical procedures: up 34% from 2006 to 2008
- Country with the most hair restoration procedures: USA
- Region with biggest increase in number of procedures: Middle East
Women
- Percentage of female hair restoration patients continues to increase: to 15.1% in 2008
- Percentage of female non-surgical patients jumps in 2008: to 31.8% in 2008
Age
- Most popular age range to have a hair transplant: ages 30 to 49
- 59.6% of men were in that range
- 54.9% of women were in that range
- On average, male patients having surgical hair restoration were slightly younger than female patients
Non-Scalp Procedures
- Eyebrow transplant the only non-scalp procedure to increase: 11,105 in 2008 (an increase of 43% over 2006)
Number and Type of Procedures
- Number of procedures needed to achieve desired results drops: from 2.2 in 2004 to 1.4 in 2008
- Majority of surgical procedures use hair transplant strip/linear harvesting technique: 88.5%
- Use of trichophytic closure increases: to 48.9% in 2008